Cocktails and Data
In conversation with Anita Zanella, we discover why and how the sonic representation of astronomical data can help science and the general public.
05. Mar 2023

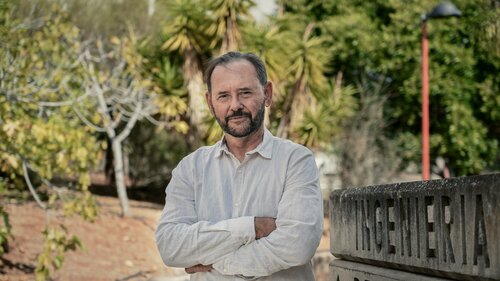
Joining us is Anita Zanella, researcher and science communicator. Could you please introduce yourself to our listeners?
Hello, I was very glad to accept your invitation. My name is Anita Zanella and I am currently a researcher at the Italian National Institute for Astrophysics, INAF. I research galaxies that are extremely far away. I am interested in how they form and evolve, and how they change shape and color over time as the universe gets older. On the other hand, I am also passionate about science communication and teaching. I love preparing popular science events for the general public and educational events in schools. I can say that I wear different hats on different occasions.
In January, you co-organized a very interesting workshop on data sonification that took place in Leiden, the Netherlands. A large number of experts from various fields gathered at the workshop. What was the purpose of this workshop?
One of the things I am interested in is the possibility of using sound to present astronomical data. I am interested in both the use of sound in research and its use for popular science communication and educational purposes in schools. In the Netherlands, we organized a workshop titled "Audible Universe". Our goal was to bring together astronomers who use sound in their work, as well as sound designers, musicians, and teachers—experts from various fields—so they could talk to one another and try to understand how best to use sound in astronomy. We also wanted to find out what the current state of the art is and how we could achieve progress in this field.
Astronomy often attracts people's attention due to its appealing visual content, such as color combinations that conjure up a picturesque view of the night sky or space. However, you mentioned that astronomers who use sound in their work also attended the workshop. Why would they use sound instead of the usual visual presentation, especially in astronomy?
We usually think of astronomy as a visual science. Researchers plot data in the form of graphs and show the public gorgeous astronomical images. Because of this, it seems that astronomy is a visual science, but I think that is only because we are so used to it. From the darkest corners of the planet, we can only see a thousand stars with the naked eye, and then we need telescopes to see further. But with telescopes, we collect data that are essentially numbers, which are then translated into images so we can interpret them. So what we have are just numbers. We also know that the retina in our eyes is sensitive to only a small part of the electromagnetic spectrum, meaning only a fraction of light. We cannot see most of the light with our eyes, and that is why we need instruments to collect it and record it as numbers.
The big questions we are asking these days are, for example, whether we can translate these numbers not only into images, but also into sound, and how we can do that. There are several reasons for this. The most important one is that sound, perhaps combined with visualization, could make astronomy accessible to everyone, including the blind and visually impaired. Currently, blind individuals are excluded from science classes at a very early age, simply because we lack the appropriate tools and aids. Using sound would make it possible to introduce them to astronomy and enable a career. Currently, there are only six blind astronomers in the world, which means one blind astronomer per two thousand people, which is extremely few. The use of sound could help make the scientific community more diverse.
On the other hand, there are cases where sound could greatly help in research. A good example is the cocktail party effect. Imagine we are at a party where we hear our friend speaking on the other side of the room. We can easily hear their voice despite the noise of the party. Astronomers usually observe objects with very weak signals in a noisy background. In this case, our ears could help us find these weak signals in the noise. Our ears can even be better than our eyes. So there are instances where sound could also help people who otherwise have good vision.
As a third fact, the advantage of sound in preparing popular science material is that sound can be very pleasant and inviting. By using sound, we can increase public interest.
The cocktail party effect can be tested with the example of a black hole. Listen to what a black hole merger without noise is supposed to sound like. The second audio recording is noisy, as astronomical data typically is. In this second recording, you can check if you can hear the black hole merger despite the noise.
Did you succeed? The sound you heard was prepared by the Black Hole Hunter team, who designed an online game. On their website, you can have fun with other examples of searching for the sound of black hole mergers.
Let's return to the question you highlighted yourself: how do we sonify sound? We have a dataset, how do we then turn it into sound?
The translation of numbers into sound is arbitrary. We have to decide which physical parameter to assign to a sound parameter. Sound has 12 parameters, as well as temporal and spatial dimensions, for example where the sound comes from, then we have pitch, timbre, duration of the sound, and so on. We can therefore decide to connect the color of the data with the pitch, or the distance of the source we are studying with the timbre, and so on. Currently, there are no standards, and this is one of the challenges and a topic we are currently working on. Psychoacoustics researchers, for example, have studied some of these issues and prepared recommendations.
Precisely for this reason, we invited people from various fields to the "Audible Universe" workshop so that we can learn from them and start applying their standards within the astronomical community as well. They taught us, for example, that if we want to classify objects, such as elliptical and spiral galaxies, it is best to use timbre for this. But if we want to compare objects, such as bright and dark galaxies, where there is a continuum from the brightest to the darkest galaxies, then it is better to use pitch. Sonification is therefore arbitrary, but we are developing standard parameters.
Our audience has already heard some examples of astronomical data sonification that we used in previous seasons of the podcast. But those were raw data that were simply shifted to frequencies we can hear. You mentioned that progress has been made in this field. What do you think are the next steps that would enable astronomers to use sound for data representation?
I will answer in a perhaps slightly provocative way. The sonifications that astronomers are currently producing are indeed inadequate. We cannot send them to the general public because no one would listen to such sonifications. I hope that in collaboration with musicians and sound designers, we will develop somewhat more pleasant sonifications. This is truly crucial for popular science presentations and workshops in schools.
It is the same difference we see between raw data and raw visualization used in research, and the beautiful images we present to the public. We need to do the same here. We can have ugly sonifications for researchers, which are certainly interesting, but then we also need to prepare pleasant and nice sonifications for the public and for children in schools. I think this is the next challenge, and one of the reasons why we need to involve musicians and data sonification experts in the process.
What are the other challenges you encounter in sonification?
As I mentioned, one of the challenges is the lack of standards. Everyone can create a sonification in their own way, but then it is very difficult to understand what we are listening to. That is why we need standardization, in a similar way to how we have standards for images.
The next thing is the skepticism we face, say in academic environments. When we ask researchers to listen to data, they first ask us, "But why? I can see them, why should we also have to listen to them? I have my own tools for looking, why should we change our way of working?", and also why sonification should work. I think we need to introduce rigorous testing and evaluation of sonification. We need to check when sonification works, why it is useful, when it is more useful than visualization, and when it can be used simultaneously with visualization. We need proof that this is an effective method of data analysis.
We must do the same with the public. The public does not know that astronomy is not visual and that data are just numbers. We need to tell them: We start with numbers, and then we give you images, but we can also give you sound. You can trust that we can explore data with sound. So the next thing we need to do is raise public awareness that anyone can engage with astronomy and learn about it, regardless of their disability, visual impairment, and so on.
In connection with this, every year we organize an astronomy festival. It takes place in June near Mantua in northern Italy. This year the theme will be "Multisensory Astronomy", and the title will be "The Universe in all senses". All activities will be presented to the public using at least two different senses. This will make the festival accessible to everyone, regardless of any potential disability. It is a challenge, but I think it is a wonderful one to overcome.
What are the additional advantages of sound presentation of data compared to visual presentation?
One of the advantages is working with noisy data. An audio recording can help in such a case. As I already mentioned, sound has up to twelve parameters that we can use. In astronomy, we increasingly work with so-called big data, for example data cubes or even multi-dimensional data. Visualizing such data is very difficult because we can only use up to three spatial dimensions. In such a case, we could combine visual and sound representation and thereby expand the number of dimensions we can explore simultaneously. This could therefore increase the parametric space or the exploration space that astronomers can achieve with data.
The next example is phenomena in the sky that are short-lived in nature (transients). At one moment a light source appears, and in the next moment it already disappears. In this case, an astronomer in the telescope control room must quickly repeat the observation of this object. Instead of staring at a screen, we could set up an audio alarm when such events occur. Audio is very useful in such a case. With our eyes we can do something else in the meantime while listening to sound and waiting for an alarm, just like we do, for example, in control rooms, hospitals, and other situations. So sound is useful for monitoring alarms.
Listen to the sonification of stars beginning to appear in the night sky after sunset in Chile at the Very Large Telescope, operated by the European Southern Observatory. The brighter ones are heard even before the sun sets. Color is represented by pitch: higher for blue stars, lower for red stars. Their location in the sky is tracked via stereo effect. The original version of this recording was made for the video *Audio Universe: Tour of the Solar System*, which is suitable for planetariums.
How to convince researchers to use two types of senses at the same time? We are truly not used to that.
This is the next challenge in sonification. We conducted an experiment where we presented astronomers and laypeople with some sonifications and some graphs made with the same data. We found that astronomers performed very well at reading graphs, while non-astronomers did only moderately well. With sonification, however, both groups performed equally well, and the level of success was the same.
What we found is that astronomers are trained data viewers. If we want to use sound, we need to teach people the skills of active listening. For learning, we must integrate sonification into schools within the general curriculum, and we are currently working on this. We have a PhD student in psychoacoustics and astronomy, and this is the first such doctoral research that I am aware of. What we are doing is testing in primary schools.
We use sonification multiple times throughout the year and monitor how much children learn through sonification, how actively they participate, and whether they engage more in science using sound compared to just vision. At this school where we are implementing the project, there are also blind students. This is the reason why we started there. We are also monitoring how the perception of blind and sighted students changes when we use sound in science and the possibilities of working in science regardless of disabilities.
Sonification is used in topics related to astronomy, but data are also collected in other branches of science. Do you know of other fields that are also starting to use data sonification?
At least in Italy, astronomy is not part of the general school curriculum, so we try to introduce the topic of sonification in geometry, mathematics, and science classes, and we also introduce some astronomy there. If we succeed in presenting sonification across all scientific disciplines, then that is already a very good step forward. In schools, teachers are exploring and using sonification tools in art classes, because that is a subject where blind students face difficulties. Apart from that, in a professional environment, sonification is widely used in biology and seismology. So there is a large number of studies where sonification has been used, and they have even led to new discoveries. One of the things we did in collaboration with Sara Lenzi, who is a sound designer, was to gather all the sonification tools and applications currently available across all disciplines. There is an archive of all sonified data, and they can be searched by keywords and disciplines. I hope this will accelerate the development of sonification.
The archive of sonified data is publicly available and can be browsed here.
You mentioned that sonification is already becoming an important part of research and that some astronomers are already using it in their work. To help us picture this, can you give us a few examples of what they are actually doing and how they use sonification?
There are only a few examples because it is still a niche. One of the first sonifications in astronomy was done by Donald Gurnett in the 1960s. It involved data collected by the Cassini space mission. At one point, something was wrong with its electronics, and they couldn't figure out what it could be. They visualized the data, but didn't get any useful information. Then at some point, one of the engineers suggested: "Let's try sonifying the data!" What they heard sounded like the sound of a pistol shot, and that's how they figured out that meteorites were "hitting" the electronics and causing damage.
Another example is described in an article, I think from 2012, where they investigated the ratio of element isotopes in certain stars. They found signals in the data using sound. This then guided the visualization and statistical analysis. I don't think we can imagine how we could use sonification for quantitative analysis—for that we have code and statistics, and that's all we use. I imagine that sonification can be used in the same way we currently use visualization, meaning just for exploring the database, that is, guiding our statistical tools.
There are quite a few data sonification programs available online for free and for use in other sciences as well.
Yes, most of them are available online for free download and use on a personal computer. There are various tools that use different methods for data sonification, and they are designed to sonify different types of data. Some sonify only one-dimensional data, others can sonify images, and some are starting to sonify 3-dimensional data cubes. Some use only sound, while most also use visual tools.
One of them, which we now also use in schools, uses artificial intelligence. It is called Herakoi. It can recognize the user's finger, and as we slide across the image, we listen to the sound of the colors and peaks we are touching. This is very effective for the general public and in schools. All of them are freely available for use on a home computer. The only drawback is that they mostly lack instructions for use, and this is where we are pushing developers to write user manuals, use cases, and peer-reviewed articles. This would greatly help users and aid in spreading the use of sonification.
We started the interview with the workshop you organized, and let's end with that topic as well. Did you encounter any obstacles and challenges during the organization, given that this is a new research field?
It's a new topic, a new field, and new people. The workshop could have been a huge success or a huge flop. I think the workshop was a success, but as you said, we encountered challenges. The biggest one was finding the right language to communicate, at least in the beginning. You put astronomers and sound designers in a room, and everyone knows the word "frequency," but they use it in different ways, or the word means different things. So we are using the same words, but we are not speaking the same language. That was one thing we had to get used to. It required a lot of patience from all participants, as well as explanations of what the words they use actually mean. It required openness and a willingness to ask questions, as well as asking questions about ambiguities, which is not so typical for researchers [laughs]. We don't like to admit that we don't know or understand something, and that truly was the first hurdle and the first step we had to overcome. I think we succeeded; the atmosphere was very playful and encouraging. I think it was a good and right place to hold it.
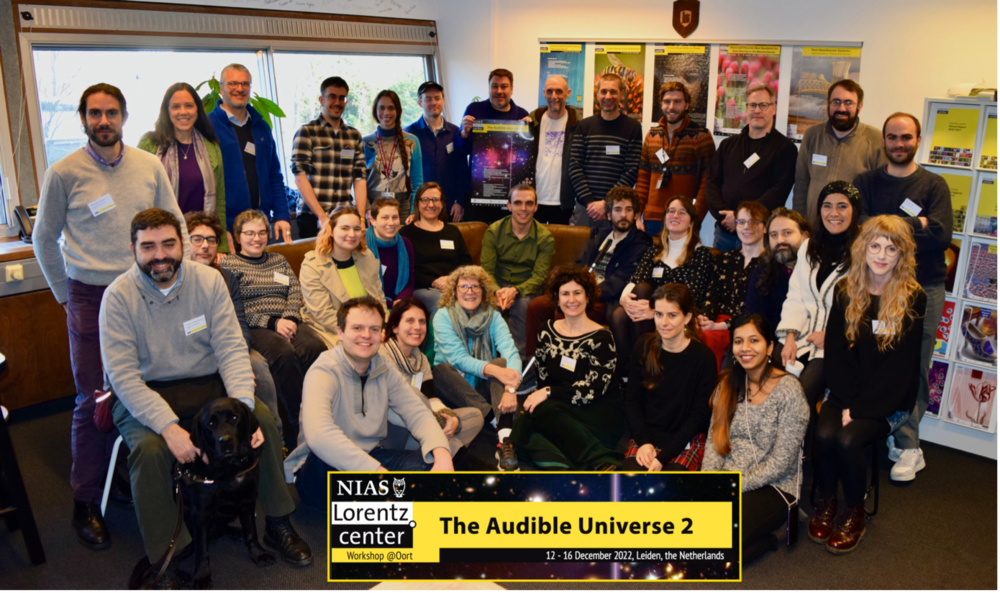
WORKSHOP AUDIBLE UNIVERSE 2 IN THE NETHERLANDS, 2022. PHoto: Lorentz Center.
Are you already planning the next workshop like this?
That was already the second one. The first one was organized online due to the pandemic and lasted only a very short time—three days. Then we wanted a follow-up with in-person attendance, and that is the conference that took place in December and lasted five days. The next big event will be at the end of June. It is a large conference, not organized by astronomers, but usually by sound designers and musicians. It is called ICAD. At this conference, they mostly present auditory displays, organize concerts, and cover a wide range of applications. They will be organizing a special session on astronomical data sonification. So that is the next such event.
Anita, thank you so much for the interview and the very interesting information. I think we've learned a lot, including about sonification. We hope to hear from you again soon in one of the upcoming episodes.
Thank you, I was very happy to accept your invitation.